.png)
%20(2).svg)
Introduction
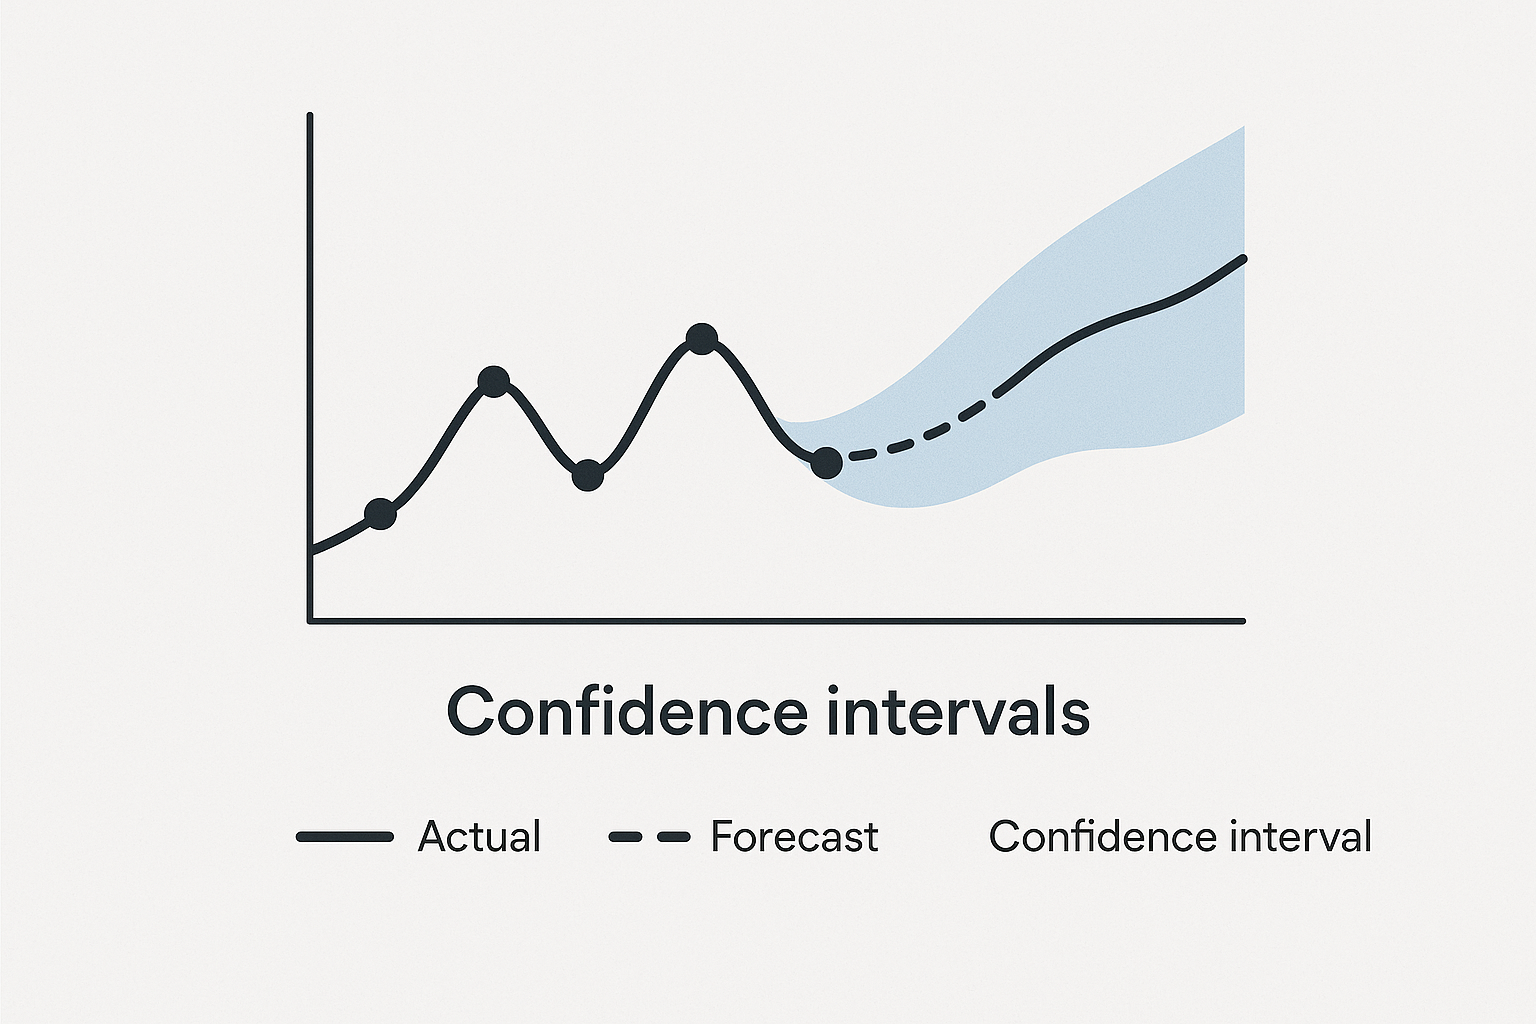
Forecasting is only as good as the metrics you choose to evaluate it. Too often, teams focus on producing forecasts without a clear understanding of how to measure their accuracy or usefulness. This leads to models that may look impressive in a test environment but fail when applied to real business decisions.
The truth is simple: choosing the right forecasting metrics is not optional—it’s foundational. Without them, organizations risk misallocating resources, making poor strategic choices, and ultimately eroding trust in predictive initiatives.
In this article, we’ll explore the most important forecasting metrics, why they matter, and how to align them with your business objectives.
Why Forecasting Metrics Matter
Imagine two forecasting models:
- Model A predicts sales with a Mean Absolute Error (MAE) of 10 units.
- Model B predicts sales with a Mean Absolute Percentage Error (MAPE) of 5%.
Which is better? The answer depends entirely on context. If you’re forecasting high-volume items (tens of thousands of units), an error of 10 is negligible. But if you’re forecasting niche products sold in small quantities, that same error could be disastrous.
This example highlights why forecasting metrics must be chosen carefully. They provide the lens through which you judge success — and if the lens is distorted, so are your decisions.
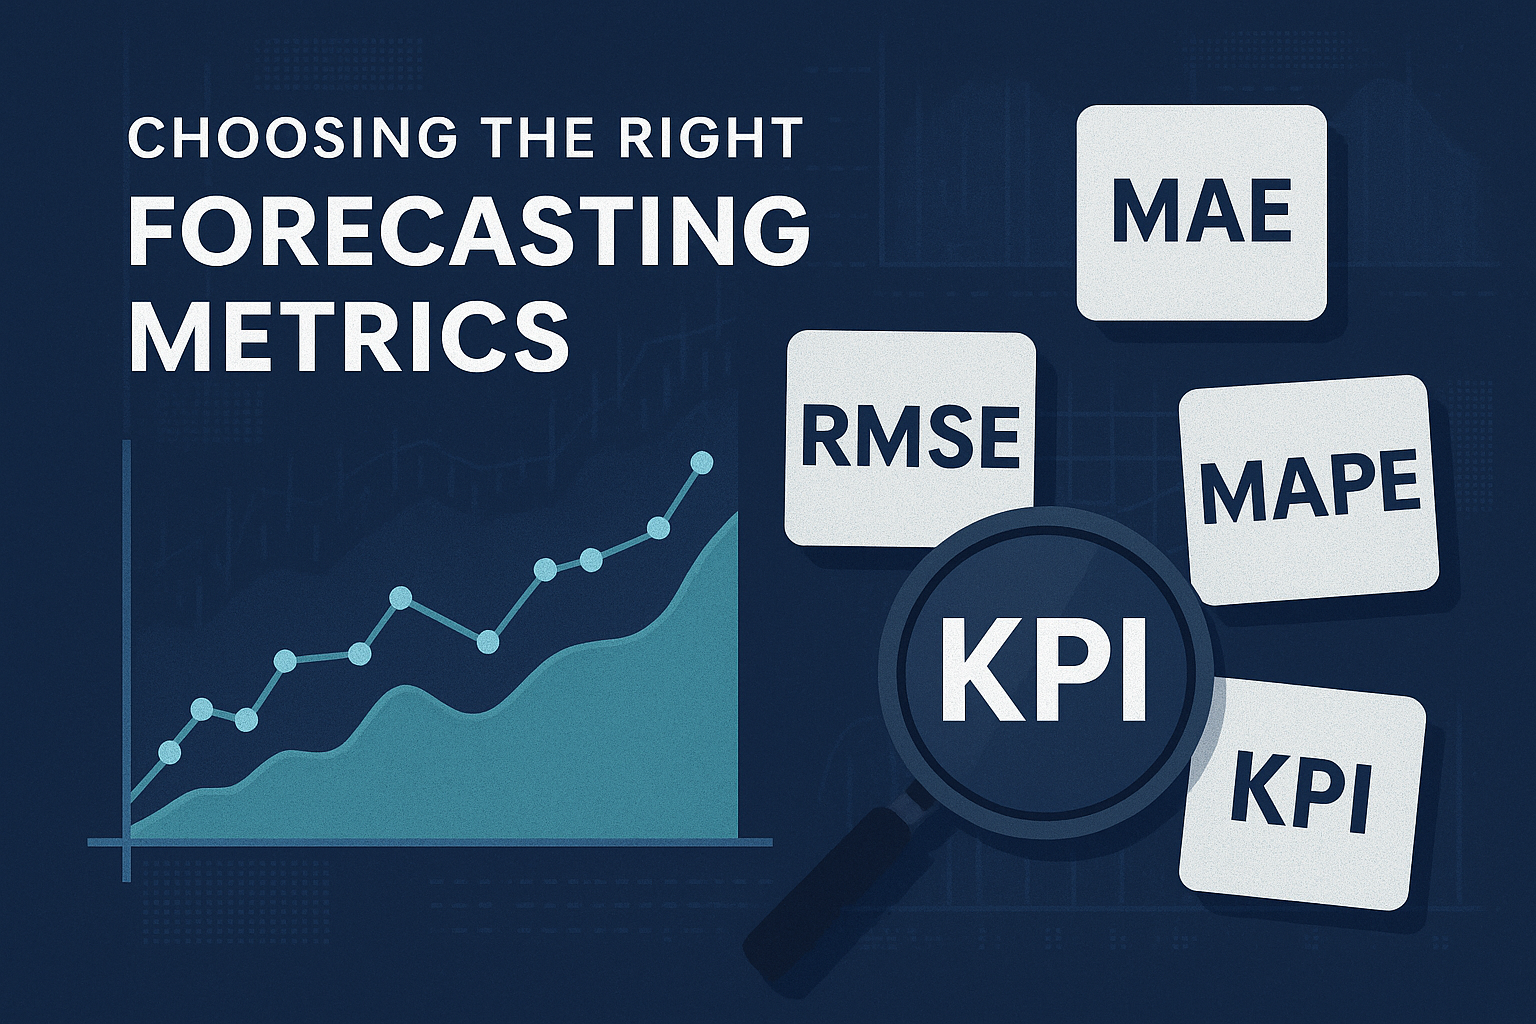
Common Forecasting Metrics Explained
1. Mean Absolute Error (MAE)
MAE measures the average absolute difference between predicted and actual values. It’s intuitive and easy to interpret, making it a go-to metric for many teams.
- Strengths: Simple, doesn’t penalize large errors disproportionately.
- Limitations: Not scale-independent, meaning results are harder to compare across datasets of different magnitudes.
2. Mean Absolute Percentage Error (MAPE)
MAPE expresses error as a percentage, making it easier to communicate performance across different scales.
- Strengths: Scale-independent, easy to explain to stakeholders.
- Limitations: Breaks down when actual values are close to zero (percentage error becomes inflated).
3. Root Mean Square Error (RMSE)
RMSE squares the errors before averaging, which penalizes large deviations more heavily.
- Strengths: Useful when large errors are especially costly (e.g., financial forecasting).
- Limitations: Less interpretable for non-technical audiences, sensitive to outliers.
4. Symmetric Mean Absolute Percentage Error (SMAPE)
A variation of MAPE designed to address its shortcomings, SMAPE uses the sum of predicted and actual values as a denominator.
- Strengths: Handles zero or near-zero values better.
- Limitations: Can still be unstable with highly volatile datasets.
5. Business-Oriented KPIs
Not all forecasting should be judged by statistical measures. For many organizations, business KPIs such as revenue accuracy, stockout reduction, or margin improvement are just as important.
These tie forecasting accuracy directly to operational impact, ensuring models are aligned with strategic goals.
How to Choose the Right Metric
The key is alignment: the metric should reflect both the nature of the data and the business cost of error.
- High-volume forecasting (e.g., retail, supply chain): MAE or RMSE may be sufficient, since absolute error matters more than percentages.
- Low-volume or diverse product portfolios: MAPE or SMAPE are better choices to normalize across scales.
- Strategic financial planning: RMSE or business-specific KPIs are critical, as large errors carry disproportionate risks.
- Customer experience use cases (e.g., churn, demand): Business KPIs should complement statistical metrics to ensure forecasts translate into real impact.
The Bigger Picture
Choosing the right forecasting metrics is about more than just model evaluation. It’s about building trust in AI-driven predictions. A sales leader or CFO doesn’t care about MAPE in isolation—they care about how predictions reduce risk, improve planning, and drive better outcomes.
The best teams therefore use a portfolio of metrics: one statistical, one percentage-based, and one business-oriented. This triangulation ensures forecasts are not only mathematically sound but also strategically relevant.
Conclusion
Forecasting without the right metrics is like navigating without a compass. The models might look sophisticated, but without clear measures of success, their business value remains uncertain.
By carefully selecting the right mix of metrics—MAE, MAPE, RMSE, SMAPE, and business KPIs—you can ensure your forecasting is not only technically accurate but also actionable, relevant, and trusted by decision-makers.
In predictive AI, metrics are more than numbers — they are the bridge between data science and business value.