.png)
%20(2).svg)
Introduction
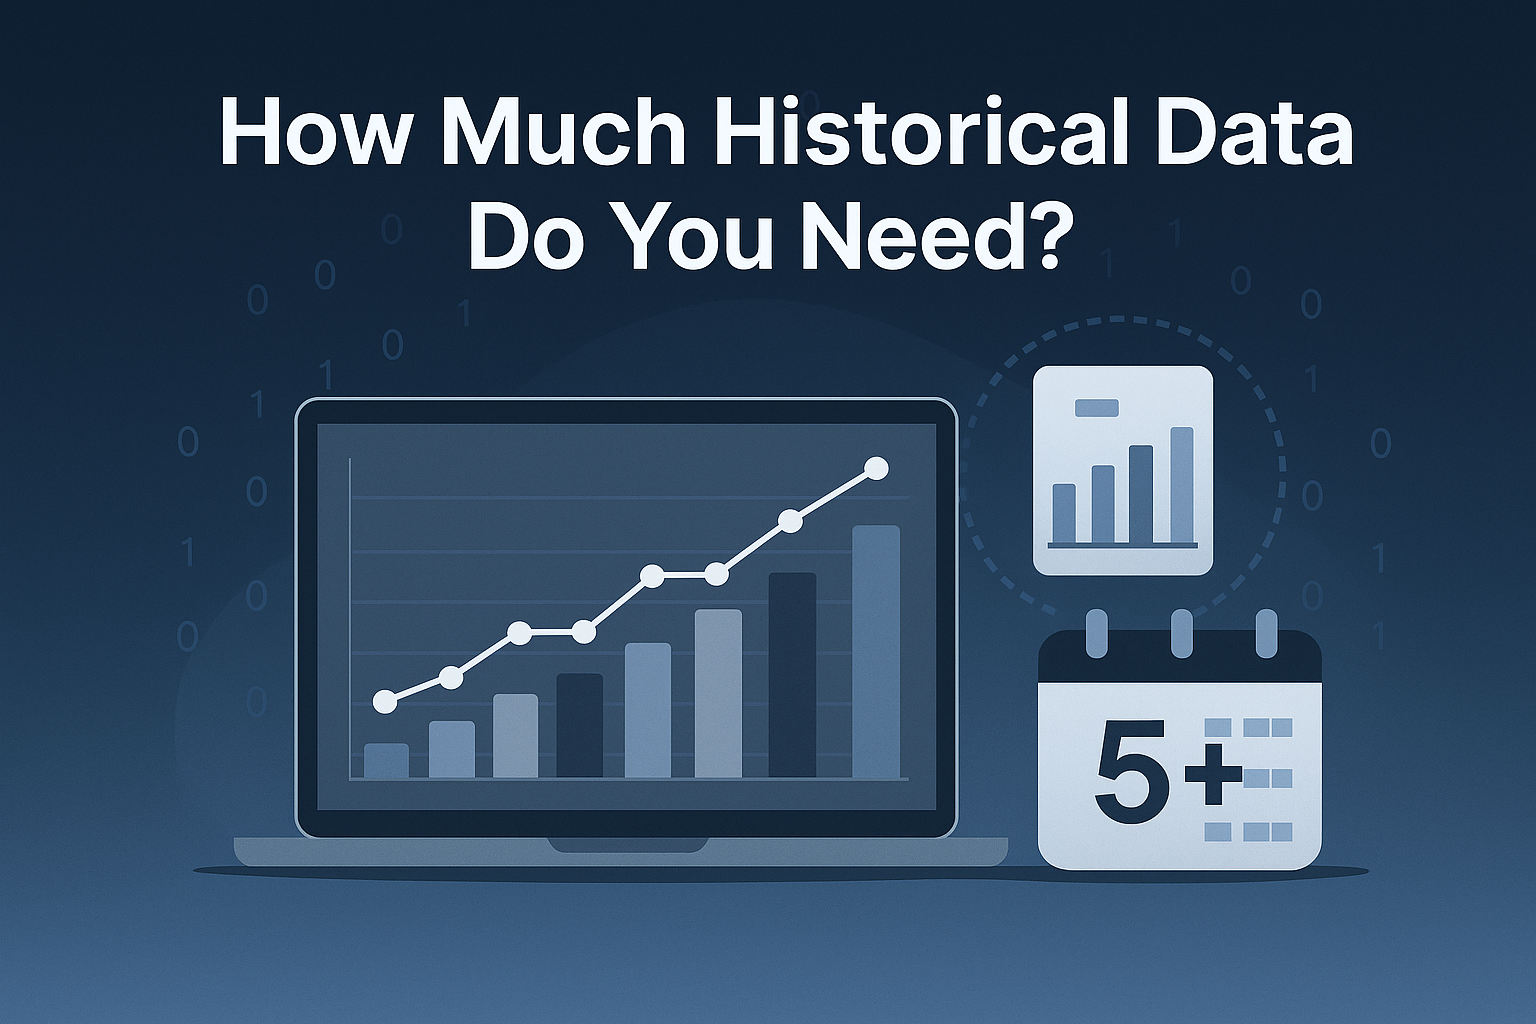
When teams start a forecasting project, one of the first questions that arises is deceptively simple: How much historical data do we need?
There’s no universal answer — and yet, this single decision can determine whether your model delivers actionable insights or misleading noise.
Too little data, and your model won’t detect meaningful trends. Too much, and it risks overfitting to outdated patterns or wasting compute resources.
In short: more data isn’t always better.
This article explores how to think strategically about data volume, time horizon, and relevance when building forecasting systems that perform well in the real world.
Why Historical Data Matters
Forecasting models learn by recognizing patterns between past and future. Historical data provides the foundation for this learning — it defines the context, seasonal cycles, and relationships that power predictive accuracy.
But historical data is not all created equal. Data collected under different conditions, outdated processes, or inconsistent metrics can introduce drift, confusing your model rather than strengthening it.
The goal isn’t just to have more data — it’s to have relevant data that reflects how your business behaves today.
The Goldilocks Principle of Data History
Think of forecasting data like time: too short, and you miss the pattern; too long, and you lose the signal.
The ideal window depends on three main factors:
- Business Dynamics
- Fast-changing industries (e.g. e-commerce, tech) may only need 6–18 months of data before conditions shift.
- Stable environments (e.g. utilities, manufacturing) can leverage 3–5 years or more.
- Fast-changing industries (e.g. e-commerce, tech) may only need 6–18 months of data before conditions shift.
- Seasonality
- To model seasonal effects accurately, you need at least two full seasonal cycles.
- For quarterly businesses, that’s roughly two years of history.
- To model seasonal effects accurately, you need at least two full seasonal cycles.
- Forecast Horizon
- The further ahead you want to forecast, the more history you need to capture long-term patterns.
- As a rule of thumb: at least 10x the length of your forecast horizon (e.g. 12 months of forecast → 10 years is ideal, though often impractical).
- The further ahead you want to forecast, the more history you need to capture long-term patterns.
The Pitfall of “More Data Is Better”
Many teams assume that adding more historical data automatically improves model accuracy. In reality, it can have the opposite effect.
Older data may reflect outdated pricing models, product lines, or customer behaviors that no longer exist. This creates concept drift — when the relationships in your data evolve over time, but your model still learns from obsolete contexts.
The result: forecasts that look statistically sound but fail in practice.
Forecasting models should learn from the recently relevant past, not the ancient history of your business.
Quality Over Quantity
The quality of your historical data often matters more than its quantity. A smaller, cleaner dataset that reflects your current business environment will outperform a larger one riddled with inconsistencies or structural changes.
You can enhance data quality by:
- Filtering out regime shifts (e.g. pre- vs post-pandemic data).
- Normalizing for business changes, such as new geographies or pricing models.
- Filling gaps using interpolation or domain-specific knowledge.
In predictive AI, consistency beats length.
Practical Benchmarks by Use Case
Here’s a general guide for determining data sufficiency across common forecasting domains:
- Retail Demand Forecasting
- Historical data: 2-3 years
- Goal: Captures seasonality and product lifecycle changes
- SaaS Churn Prediction
- Historical data: 12-18 months
- Goal: Reflect recent user behavior patterns
- Financial forecasting
- Historical data: 3-5 years
- Goal: Stable macro cycles improve accuracy
- Pricing Optimization
- Historical data: 12-24 motns
- Goal: Elasticity modeling and campaign impacts
- Energy Demand Forecasting
- Historical data: 5+ years
- Goal: Long seasonal and environmental dependencies
These are not rigid rules — they’re starting points. The optimal window depends on how volatile your environment is and how often structural changes occur.
How to Test Whether You Have Enough Data
You don’t need to guess whether your dataset is large enough.
Here’s how to test it empirically:
- Backtest at Different Window Lengths
Train models on progressively shorter historical spans (e.g., 5 years, 3 years, 1 year). Observe how performance changes. - Measure Stability of Forecasts
If forecasts remain consistent as you shorten the window, you likely have sufficient data. - Monitor Performance Drift
Large performance swings suggest your dataset may be too small or too noisy for stable learning.
The Business Trade-Off
Collecting and maintaining more data comes at a cost — in storage, processing, and complexity. The right balance depends on the marginal gain of additional history.
Ask yourself:
- Does adding more data improve accuracy significantly?
- Or does it just increase training time and model complexity without meaningful returns?
In most cases, the smartest forecasting teams don’t use all available data — they use the most relevant subset.
Conclusion
Forecasting isn’t about predicting the future with all the data you have. It’s about predicting the future with the right data
.
Whether you’re building demand forecasts, churn models, or financial projections, your success hinges on understanding the trade-off between historical depth and business relevance.
The goal isn’t to feed your model every data point since day one — it’s to give it a window that mirrors how your business behaves today.
* Retail Demand Forecasting
2–3 years
Captures seasonality and product lifecycle changes
SaaS Churn Prediction
12–18 months
Reflects recent user behavior patterns
Financial Forecasting
3–5 years
Stable macro cycles improve accuracy
Pricing Optimization
12–24 months
Enough for elasticity modeling and campaign impacts
Energy Demand Forecasting
5+ years
Long seasonal and environmental dependencies
These are not rigid rules — they’re starting points. The optimal window depends on how volatile your environment is and how often structural changes occur.
How to Test Whether You Have Enough Data
You don’t need to guess whether your dataset is large enough.
Here’s how to test it empirically:
- Backtest at Different Window Lengths
Train models on progressively shorter historical spans (e.g., 5 years, 3 years, 1 year). Observe how performance changes. - Measure Stability of Forecasts
If forecasts remain consistent as you shorten the window, you likely have sufficient data. - Monitor Performance Drift
Large performance swings suggest your dataset may be too small or too noisy for stable learning.
The Business Trade-Off
Collecting and maintaining more data comes at a cost — in storage, processing, and complexity. The right balance depends on the marginal gain of additional history.
Ask yourself:
- Does adding more data improve accuracy significantly?
- Or does it just increase training time and model complexity without meaningful returns?
In most cases, the smartest forecasting teams don’t use all available data — they use the most relevant subset.
Conclusion
Forecasting isn’t about predicting the future with all the data you have. It’s about predicting the future with the right data
.
Whether you’re building demand forecasts, churn models, or financial projections, your success hinges on understanding the trade-off between historical depth and business relevance.
The goal isn’t to feed your model every data point since day one — it’s to give it a window that mirrors how your business behaves today.