.png)
%20(2).svg)
Introduction
When businesses adopt forecasting models, the first thing most people ask is simple: What’s the prediction?
But there’s a second, more important question that rarely gets asked: How confident are we in that prediction?
Confidence intervals are the answer to that question. They don’t just tell you what your model expects — they tell you how much uncertainty is baked into that expectation. Ignoring them is like driving with GPS coordinates but no sense of distance or accuracy.
In this article, we’ll unpack what confidence intervals really mean, why they’re critical for decision-making, and how to interpret them correctly in a business context.
What Are Confidence Intervals?
A confidence interval (CI) is a range around your forecast that expresses uncertainty — the margin within which the true value is likely to fall.
For example:
A model forecasts monthly revenue at €1.2M, with a 95% confidence interval between €1.1M and €1.3M.
This means that if we repeated the same forecasting process 100 times under the same conditions, we’d expect the true revenue to fall within that range 95 times out of 100.
It’s not a guarantee — it’s a probabilistic statement about trust.
Why Confidence Intervals Matter
1. They Turn Forecasts Into Decision Tools
Point predictions (like “€1.2M next month”) look precise, but they hide uncertainty. Confidence intervals expose that uncertainty, helping decision-makers plan for a range of possible outcomes.
A retailer, for instance, can plan inventory levels based not only on expected demand but also on the upper bound of the forecast — ensuring they’re covered in case of high demand.
Good forecasting doesn’t eliminate uncertainty — it quantifies it.
2. They Build Trust in Predictive AI
When stakeholders see a single number, they either believe it or they don’t. But when you show a forecast with an interval, you demonstrate rigor, transparency, and realism.
Confidence intervals make AI forecasts feel credible, because they acknowledge what every experienced manager already knows: the future is uncertain.
3. They Enable Better Risk Management
Financial teams, supply chain planners, and sales leaders all operate within risk constraints. A 10% confidence band around a revenue forecast can change how budgets are allocated or how safety stock is managed.
Understanding the range of plausible outcomes helps companies mitigate risk without overreacting to variance.
How Confidence Intervals Are Calculated
While the underlying math can be complex, the concept is simple: the interval is derived from the variability in past errors of your model.
Common approaches include:
- Statistical models (ARIMA, ETS): Based on residual variance and normal distribution assumptions.
- Machine learning models (XGBoost, Prophet, Neural Nets): Often use bootstrapping or quantile regression to approximate uncertainty.
The width of the interval depends on two things:
- The variability of your data (more noise = wider intervals)
- The desired confidence level (higher confidence = wider intervals)
In business practice, 80%, 90%, and 95% are the most common confidence levels used.
Interpreting Confidence Intervals Correctly
Confidence intervals are often misunderstood. Here’s how to think about them clearly:
- Narrow intervals suggest stable, predictable systems.
- Wide intervals indicate volatility or sparse data.
- Overlapping intervals between categories or periods often mean differences aren’t statistically significant.
Importantly, a 95% interval does not mean “we are 95% sure this is correct.” It means that, given the model and data, this interval would contain the true value 95% of the time if the process were repeated.
The interval doesn’t tell you certainty, it tells you repeatability.
How to Communicate Confidence Intervals to Stakeholders
For non-technical teams, confidence intervals can be intimidating. The goal isn’t to teach statistics — it’s to translate uncertainty into business language.
Instead of saying:
“The forecast has a 95% CI between 1.1M and 1.3M.”
Say:
“Based on historical variance, there’s a 95% chance revenue will fall between €1.1M and €1.3M, with €1.2M as the most likely value.”
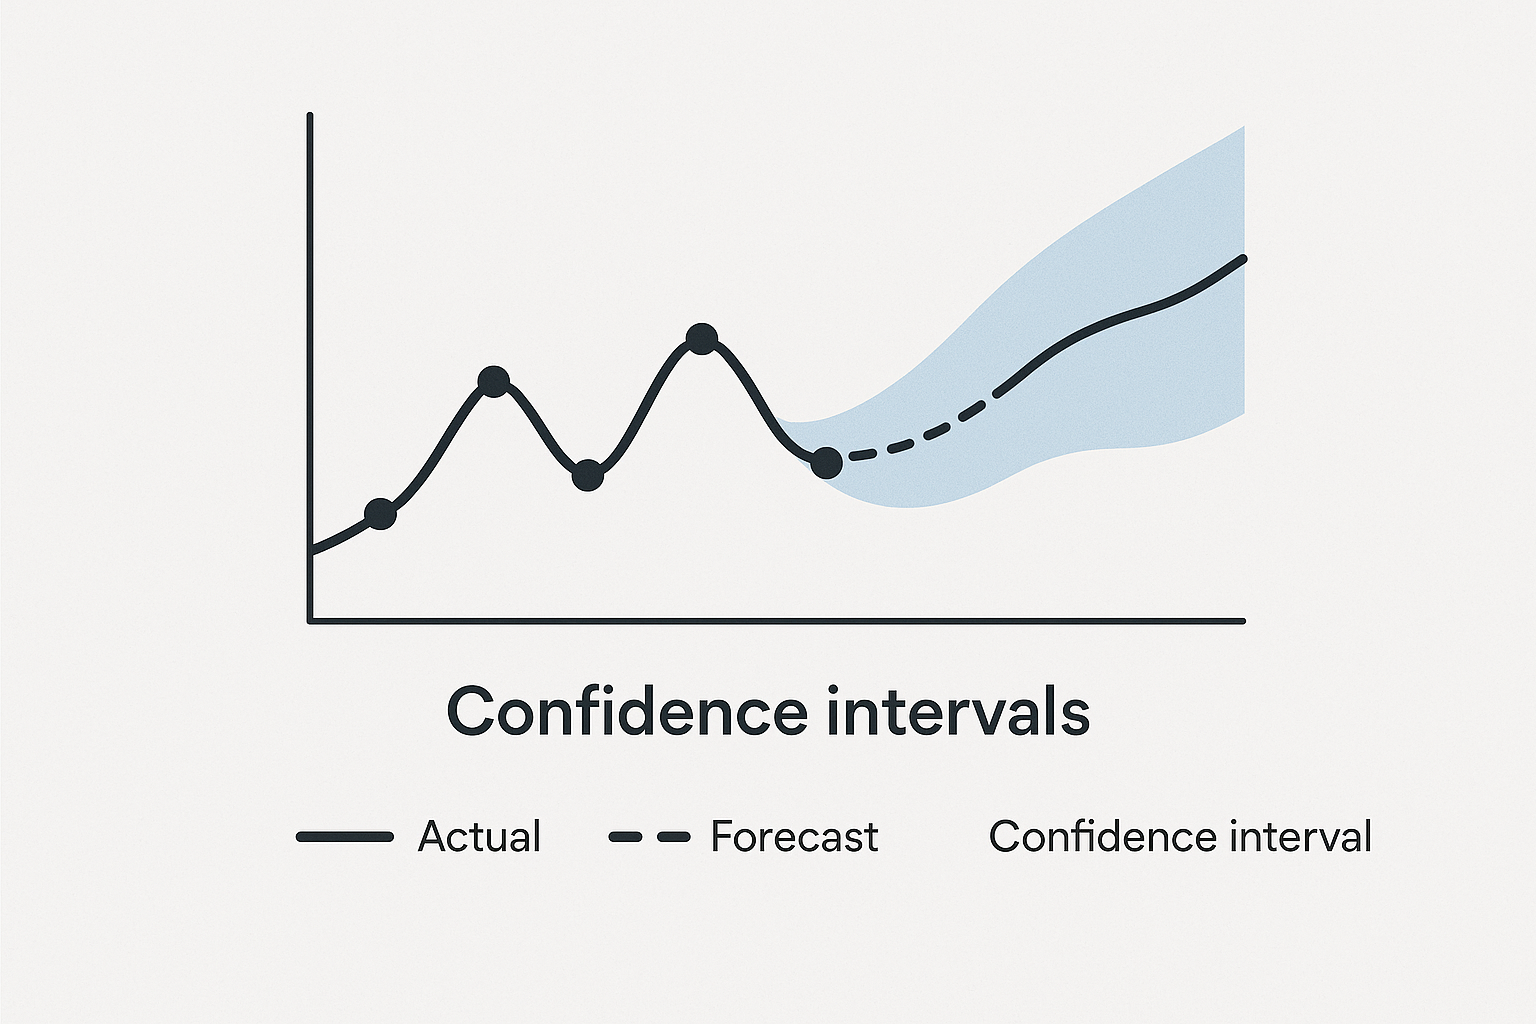
Visualizations also help. A forecast line surrounded by a shaded confidence band (like in Prophet or Orbit plots) communicates uncertainty far more effectively than raw numbers.
Business Applications of Confidence Intervals
Confidence intervals play a critical role in operational planning:
DomainExample UseDecision ImpactSales ForecastingEstimate revenue ranges for upcoming quartersBudget planning, hiring paceInventory ManagementPredict product demand with upper/lower boundsSafety stock optimizationFinanceModel risk in cash flow or margin forecastsLiquidity buffers, investment timingPricingTest elasticity models with confidence rangesPrice sensitivity analysis
In all these cases, the interval allows leaders to act confidently, not because the model is perfect, but because its uncertainty is transparent.
The Cost of Ignoring Confidence Intervals
When companies rely solely on point estimates, they make brittle decisions. Budgets overshoot, warehouses overstock, marketing teams underplan.
Ignoring uncertainty creates false precision, and false confidence.
Over time, that erodes trust not only in the forecasts but in the entire AI initiative.
Confidence intervals are not a statistical luxury; they’re a business necessity for sustainable, trustworthy forecasting.
Conclusion
Confidence intervals transform AI from a black box into a credible partner for decision-making. They don’t make forecasts less certain — they make uncertainty measurable.
In a world where every business is trying to become data-driven, understanding confidence intervals is the difference between blind trust and intelligent planning.
The most reliable forecasts aren’t the most precise, they’re the most honest about uncertainty.